Tuesday, March 29, 2011

Re-redesign

Following the results of the user study, we've made some small adjustments to the final design.
Some participants were very influenced by the fact that the museum icons and shopping icons were clustered and very separate from each other. To reduce this effect, we added a food icon within the 'museum area' and a museum icon in the 'shopping area', without making the content of the map false.


We think this will make people depend more on the visual cues than on the meaning of the icons.


Results of the User test

Last week we conducted the user test among 21 participants. Each team member went back to their hometown to do the tests.

Of all the 21 participants, 14 chose the correct (=intended) route and 7 the incorrect one.
From the museum route test, one particpant said that he would go counterclockwise (=the shopping route) because he doesn't like museums. This means that people can let their personal preference lead their decision, rather than by the visual cues.

Also the argumentation that people don't want to take their shopping bags in museums, let them choose to walk clockwise (=museum route) while they were looking at the shopping route.

In both cases, there were some participants who mentioned that the order (you go shopping and see museums or you go see museums and shopping) has an influence on the route they chose. However, they didn't know that the order was consciously picked.

Thus, the choice of going clockwise or counterclockwise is also much influenced by deeper reasoning and not only by visual cues.


Thursday, March 24, 2011

Work in progress

This week we recovered and started working with the feedback we received last week.

We gathered with the group and worked on an improved map of Delft which we could use for our user test.

In this post some small pictures that show our work in progress.


Tuesday, March 22, 2011

Final Concept

After last weeks presentation and this weeks brainstorm we have come to a final concept that we think fulfills the assignment and will subconsciously direct people towards a certain direction.

We used occlusion, things that are closer to you stand in front of things that are further away. We made the contrast of the beginning of the route higher than towards the end, because your focal attention is guided to the most contrast.


Can you tell which route is P and which is K?

Self-running Presentation guidelines


For the final presentation, we have to make a self-running presentation (=a movie).
Our first guidelines for the movie are as following:

1. Introduction of the course and group (5sec)
[we still need a group photo]

2. A bit about the process (30sec)
    Slideshow of us working and the different concepts we have developed. [photos]

3. The final design (30sec)
    What are the visual cues we used? [images]

4. The tests (60sec)
    What do people think/say/do? [footage]
    The results [graph]

5. Outro (5sec)

Ideas for redesign map of Delft

Since we had received comments about our presented map of Delft we have tried to come up with some solutions.

The biggest comment was that our route was used as an indicator and not shown in a circle. The easiest solution to overcome this problem is to place an ellipse over our existing map.


Since we all agree this is not what we are looking for either we tried to come up with some other solutions, of which one of them is developed a bit further in Illustrator.

In this case the route has become an ellipse with the icons on the route with the use of depth perception > bigger icons come first. Next to this a gradient is used to make icons look further away with a depth gradient. The building is used to attract people to the lighter side of the route. However since the contrast is bigger on the other side there are some contradicting aspects and people are attracted to the other side.

So these redesigns all still need some work, which we are going to work on this week.

Thursday, March 17, 2011

Feedback concept presentation

After the presentation last Tuesday we received some comments we can use to improve our concept.

Comments:

- The route can not be used as an indicator and needs to be 100% the same in both images.

- It is logical to place the starting point at the bottom.

- The route needs to be represented in a circle, but should not be exactly shown in the image.

- Occlusion does not seem to work at all times.

- Contrast need to be visible when eyes are pinched.

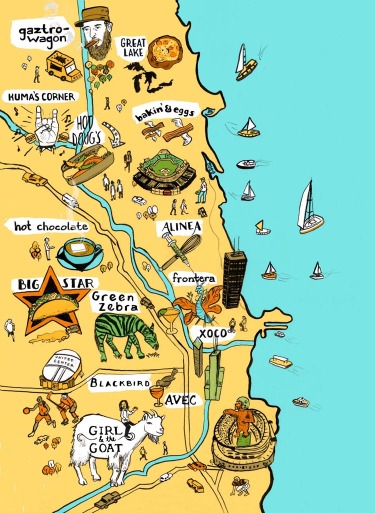
- Check for the affordances if you would go to the high buildings or try to avoid them.

- Water can be used as a reference point (how many bridges do you need to cross).

- The map can not be brought along; it is a point of taking the route clockwise or counterclockwise.

- Color can be more important than size.

- A person can not be used as an indicator; it almost functions as an arrow.

Unfortunately our solution did not really fit the desired result, so there need to be some changes, which we will try to implement in the upcoming week.

Monday, March 14, 2011

Final Concept

This is our final concept. It is based on our two concepts and the comments we received from other groups. We used mostly color and size to try and direct the viewers of the map in a certain direction.


Thursday, March 10, 2011

Map of Delft :Idea 2

Here is another idea for the map.

Can you tell which map is for the cultural route and which for the shopping route?

Map of Delft: Idea 1

This is one of our ideas of the map. Can you see the difference?


Can you tell which map is for the cultural route and which for the shopping route?

Tuesday, March 8, 2011

Some inspiration

We are all working on concepts to show the route through Delft. Because of that I think this would be a good time for some inspirational pictures of interesting maps.

This map shows how a group of people is connected, who knows who.


This is a 'food map' of chicago. All different kinds of food and where they can be found are displayed using icons, and the names of the restaurants are included.


This is the visualisation of an everyday busride. Including time and place.


This map shows where in town the highest rates of crime are, they are shown with bumps. The higher the bump, the higher the crime rate.


The Circle Through Delft

To make a start on the assignment, we thought it would be wise to look at the route given in the brief. We made a little map with dots, to show the streets that are to be followed.

Friday, March 4, 2011

Assignment 2 - First agreements

Today we agreed to develop one concept each based on the chapters we have read in the book Visual Thinking for design of Colin Ware. Both versions of the routes 'shopping' and 'culture' will be included in the concepts.

All concepts will be placed on this blog in order to create an overview of the different possibilities. Next week these concepts will be finished and discussed in order to create one concept that covers all chapters.

This concept will then be used in during the presentation on March 15.

Monday, February 28, 2011

Assignment 1 - Investigate the possibilities of manipulating visual variables.

For the first assignment of the course the pictures below were analyzed based on three chapters of the book Visual Thinking for Design, Colin Ware

 
For the painting Milk can and apples of Paul Cezanne these were the chapters;

2. What We Can Easily See
4. Color
7. Visual and Verbal Narrative

 For the poster of Grapus these were the chapters;

4. Color
5. Getting the Information: Visual Space and Time
7. Visual and Verbal Narrative
 For the advertisement of Innocent these were the chapters;

1. Visual Queries
2. What We Can Easily See
3. Structuring Two-Dimensional Space

 For the painting view-of-the-flower-of-greece these were the chapters;

1. Visual Queries
3. Structuring Two-Dimensional Space
5. Getting the Information: Visual Space and Time

 The whole document of the analysis can be downloaded here
(sorry for the unprofessional way of linking to this file, we intend to find a better way next time)